
Hubble-Prometheus-Grafana 연동하여 k8s 모니터링 하기
개념
- Prometheus
- 시스템 및 서비스의 메트릭(상태 데이터)을 수집하고 저장하는 오픈소스 모니터링 시스템
- 시계열 데이터베이스(TSDB)를 기반으로 작동
- 특정된 주기마다 타겟 시스템에 접근하여 데이터를 가져오는 풀(Pull) 방식을 사용
- Hubble이 수집한 쿠버네티스 네트워크 및 보안 메트릭을 Prometheus가 긁어와(Scrape) 저장
- Grafana
- 수집된 데이터를 시각화해주는 오픈소스 대시보드 플랫폼
환경
- WSL2 Ubuntu 24.04
- K3d, kubectl, helm
- 테스트 환경 구성 (이전 글에서 구성한 환경이므로, hubble-test 네임스페이스가 있는 경우 스킵)
# 네임스페이스 생성
k create ns hubble-test

# Web 서버 (Nginx) 배포
k create deployment web --image=nginx -n hubble-test
k expose deployment web --port=80 -n hubble-test

# Client 파드 배포
k run client --image=curlimages/curl -n hubble-test --labels="app=client" -- sleep 3600

# L7 캡쳐
cat <<EOF | k apply -f -
apiVersion: "cilium.io/v2"
kind: CiliumNetworkPolicy
metadata:
  name: "l7-visibility"
  namespace: hubble-test
spec:
  endpointSelector:
    matchLabels:
      app: web
  ingress:
  - toPorts:
    - ports:
      - port: "80"
        protocol: TCP
      rules:
        http:
        - {}
EOF
# Client -> Web
k exec -it client -n hubble-test -- sh -c "
while true; do
curl -s -w 'HTTP Status: %{http_code}\n' -o /dev/null http://web;
sleep 2;
done"설치
helm repo add prometheus-community https://github.com/prometheus-community/helm-charts
helm repo update
- 프로메테우스와 그라파나가 있는 Helm 를 추가
kubectl create namespace monitoring

# kube-prometheus-stack 설치
helm install prometheus prometheus-community/kube-prometheus-stack \
  --namespace monitoring \
  --set prometheus.prometheusSpec.serviceMonitorSelectorNilUsesHelmValues=false \
  --set prometheus.prometheusSpec.podMonitorSelectorNilUsesHelmValues=false
- 프로메테우스와 그라파나가 들어있는 kube-prometheus-stack 을 설치
helm upgrade cilium cilium/cilium --version 1.14.0 \
  --namespace kube-system \
  --reuse-values \
  --set prometheus.serviceMonitor.enabled=true \
  --set operator.prometheus.serviceMonitor.enabled=true \
  --set hubble.metrics.enabled="{dns,drop,tcp,flow,icmp,http}" \
  --set hubble.metrics.serviceMonitor.enabled=true
- 프로메테우스가 수집 가능하게 cilium 설정을 변경
kubectl port-forward -n monitoring svc/prometheus-operated 9090
- 프로메테우스 접근을 위한 포트포워딩


- Status - Target Health 선택
- kube-system 내의 cilium, hubble이 관측되고 있는지 확인(없으면 안됨!!)
프로메테우스 쿼리 테스트

- 상단에 hubble_http_requests_total 입력 후 Excute

- 상단에 cilium_agent_api_process_time_seconds_sum 입력 후 Excute
그라파나 접속
# grafana-ingress.yaml
apiVersion: networking.k8s.io/v1
kind: Ingress
metadata:
  name: grafana-ingress
  namespace: monitoring
  annotations:
    traefik.ingress.kubernetes.io/router.entrypoints: web
spec:
  rules:
  - http:
      paths:
      - path: /
        pathType: Prefix
        backend:
          service:
            name: prometheus-grafana
            port:
              number: 80
k create -f grafana-ingress.yaml.yaml
k get ingress -n monitoring
- 그라파나 대시보드 접근을 위한 인그레스 생성

kubectl get secret --namespace monitoring prometheus-grafana \
-o jsonpath="{.data.admin-password}" | base64 --decode ; echo
- ID: admin
- Password: 위에서 확인한 그라파나 대시보드 초기 비밀번호 확인
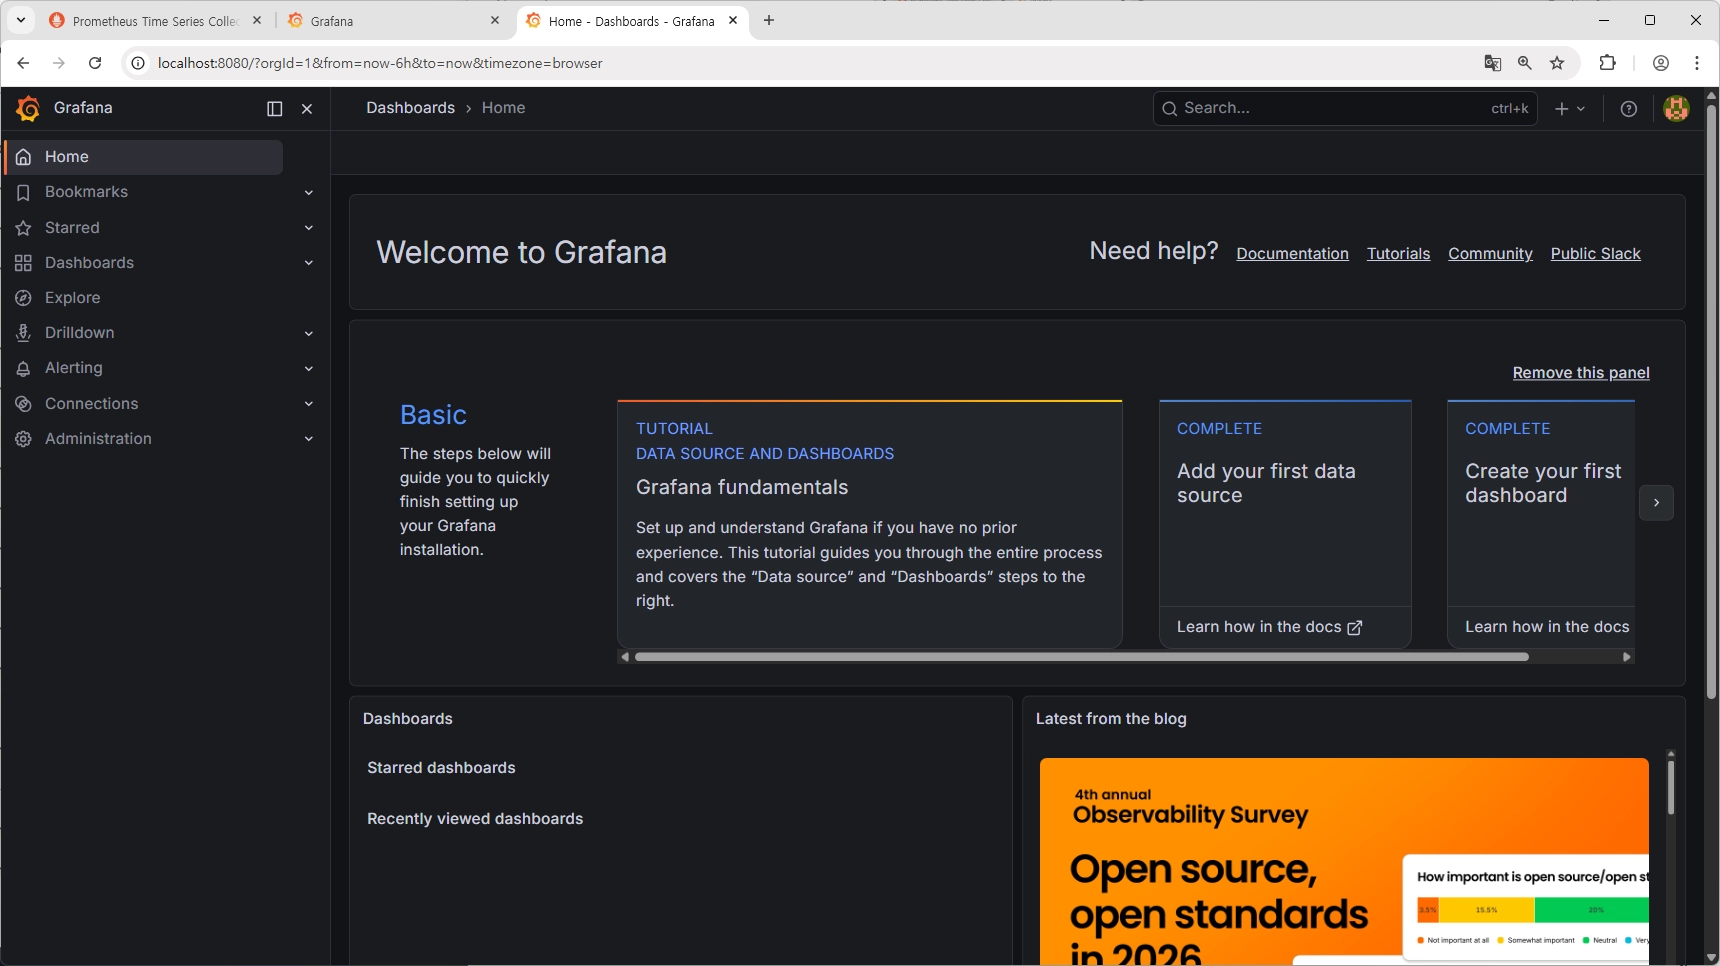
- 접속 확인
그라파나 대시보드 설정

- 좌측 Dashboards - New - Import
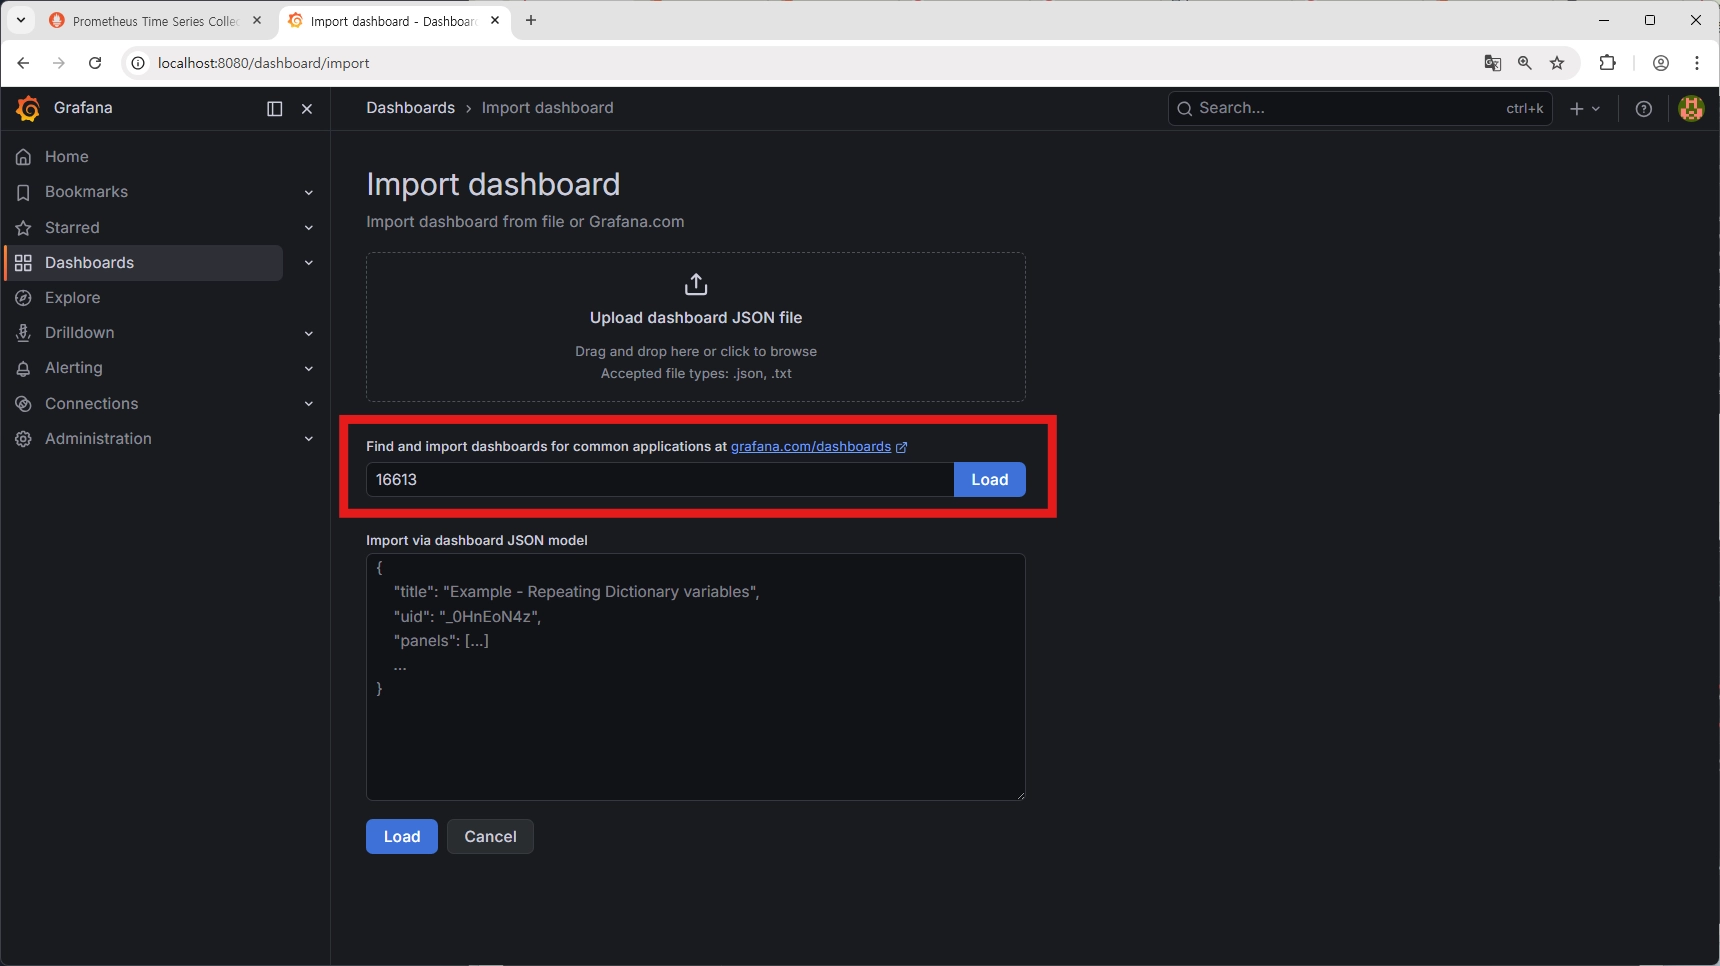

- 하단 Import

- 그래프 표시가 안 되고 있는 것을 볼 수 있다.
- DS_PROMETHEUS 변수를 추가해야 함!


- 우측 상단 Edit - Settings

- Variables - Add variable

- Variable type: Datasource
- Name: DS_PROMETHEUS
- Type: Prometheus
- 하단의 Back to list

- Name: node
- Label: Node
- Data source: ${DS_PROMETHEUS}
- Query type: Label values
- Label: node
- Metric: hubble_flows_processed_total

- 우측 상단의 Save dashboard - Save

- 매트릭이 정상적으로 출력 되고 있는 것을 볼 수 있다 !
결론
지금까지 Cilium의 Hubble이 추출한 쿠버네티스 네트워크 가시성 데이터를 Prometheus로 수집하고, 이를 Grafana 대시보드와 연동하여 시각화하는 과정을 살펴보았습니다.
이 3가지 도구의 조합을 통해 복잡한 파드(Pod) 간의 트래픽 흐름과 L7 통신 상태를 한눈에 파악할 수 있으며, 결과적으로 k8s 환경에서 보다 직관적이고 효율적인 네트워크 모니터링 체계를 구축할 수 있습니다.
'SRE' 카테고리의 다른 글
| [SRE] K3d에 Cilium & Hubble 구축: 실시간 트래픽 캡처부터 L7 분석까지 (1) | 2026.03.18 |
|---|